

Quick Summary
SEBI’s August 2026 reports show headline improvements, like a minor drop in losing traders from 90.9% to 87.7% and total losses down to ₹91,685 crore, but underlying retail reality remains tough. Average trader losses hit a 5 year high of ₹1.17 lakh in FY26. Total losses over FY25 to FY26 reached ₹2.03 lakh crore, crossing the previous three years combined. Over 45 lakh traders exited, with 58% quitting cash markets too. Transaction costs consumed ₹24,859 crore, pushing 4.4 lakh profitable traders into loss. Daily turnover rebounded to ₹1.18 lakh crore, while proprietary algos and FPIs captured most market gains.
The SEBI F&O Loss Report 2026 released two reports on India’s equity derivatives market in August 2026. The headline number improved. Almost nothing underneath it did.
On paper, this was the year the story finally turned.
The share of individual F&O traders losing money fell from 90.9% to 87.7%. Aggregate losses dropped 18%, from ₹1.12 lakh crore to ₹91,685 crore.
For the first time in a decade, the number of people trading derivatives in India actually went down.
Every one of those facts is true. Together they will produce a week of headlines about how SEBI’s crackdown worked.
Read the two reports properly and a different picture emerges, one where the average trader lost more money than the year before, where nearly 46 lakh people walked away from the market entirely, where the trading volumes SEBI set out to curb are now roughly double what they were before the rules arrived, and where four and a half lakh people made money on their trades and still ended the year in loss because of what they were charged.
This is not an argument that the reports are wrong. They are the most detailed public accounting of retail derivatives outcomes that any regulator anywhere has published.
It is an argument that the headline is the least interesting thing in 144 pages. The full findings behind this framing are laid out across both documents that together form the SEBI F&O loss report 2026.
What SEBI Actually Published?
Two separate documents, released together in August 2026 by SEBI’s Department of Economic and Policy Analysis:
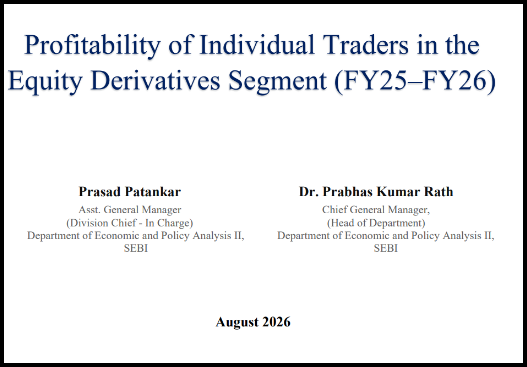
- Report A: Profitability of Individual Traders in the Equity Derivatives Segment (FY25–FY26). 91 pages. Covers 78.6 lakh traders drawn from the top 15 brokers, roughly 90% of the market.
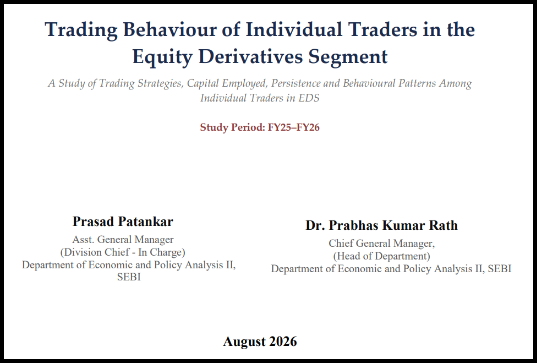
- Report B: Trading Behaviour of Individual Traders in the Equity Derivatives Segment (FY25–FY26). 53 pages. The first study of its kind in India.
It uses clearing corporation margin data to establish not just what traders earned, but how they traded, whether they bought options or sold them, how much capital they deployed, how often they traded, and what happened to them over five years.
The behavioural study is genuinely new. Every previous SEBI report could tell you that traders lost money. This SEBI F&Oloss report can tell you which kind of trader lost, and roughly why.
The Headline and What Sits Directly Underneath It
Start with the number everyone will quote.
87.7% of individual F&O traders lost money in FY26, down from 90.9% in FY25.
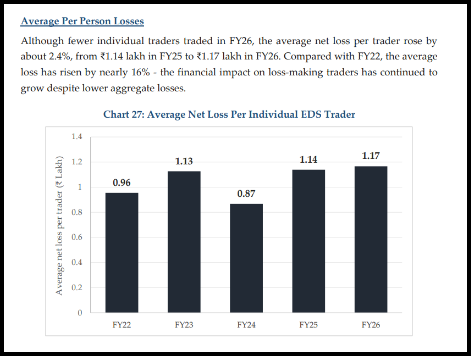
Now put the second number next to it. The average loss per trader rose to ₹1.17 lakh, from ₹1.14 lakh.
That figure has increased in every single year of the five-year series. FY22: ₹87,000. FY23: ₹96,000. FY24: ₹1.13 lakh. FY25: ₹1.14 lakh. FY26: ₹1.17 lakh. Not once has it fallen.
So what happened is not that trading got safer. It is that fewer people traded, and the ones who stayed lost more each.
There is a second reason to be careful with the improvement. SEBI’s FY25 figure of ₹1.12 lakh crore is a revised number. The earlier published figure was lower.
The revision happened because SEBI expanded its broker sample from 13 brokers to 15, which made the prior year larger. Part of this year’s celebrated decline is therefore a change in what is being counted, not purely a change in outcomes.
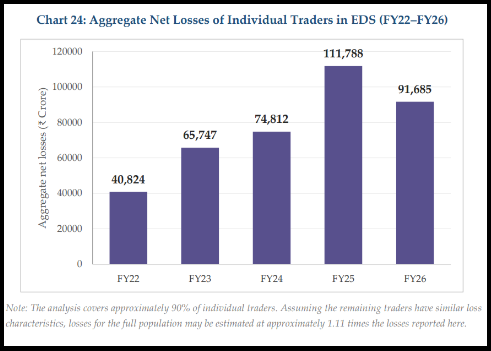
And the reported total understates the market. SEBI’s own footnote states that if the full market were included rather than the top-15-broker sample, the real figure would be roughly 1.11 times what is published.
That puts FY26 losses closer to ₹1 lakh crore.
Five Years, ₹3.85 Lakh Crore
|
Year |
Active traders |
Net losses |
|
FY22 |
51.35 lakh |
₹40,824 crore |
|
FY23 |
66.96 lakh |
₹65,747 crore |
|
FY24 |
95.75 lakh |
₹74,812 crore |
|
FY25 |
106.30 lakh |
₹1,11,788 crore |
|
FY26 |
87.71 lakh |
₹91,685 crore |
Five-year total: ₹3,84,856 crore.
SEBI makes one comparison in the SEBI F&O report that deserves more attention than it will get. The three years from FY22 to FY24 produced ₹1.81 lakh crore in losses.
The two years from FY25 to FY26 produced ₹2.03 lakh crore.
More money was lost in two years than in the three years before them.
The Exodus Nobody Is Talking About
This is the finding with the least coverage and arguably the most significance.
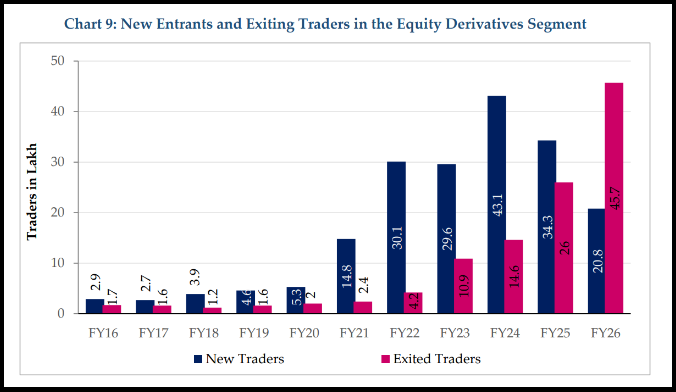
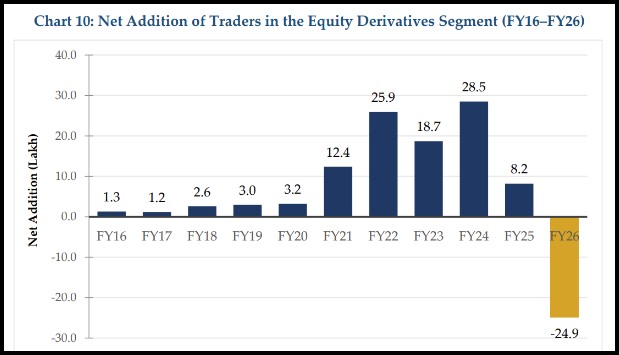
For the first time since FY16, the number of individual F&O traders fell, from 1.06 crore to 87.71 lakh.
The mechanics are stark. New entrants collapsed from 43 lakh in FY24 to 34 lakh in FY25 to just 21 lakh in FY26. Meanwhile 45.7 lakh traders exited the segment, 76% more than the previous year.
Net addition came in at minus 24.9 lakh, negative for the first time in the entire series.
Then comes the part that should trouble anyone who cares about capital markets in India.
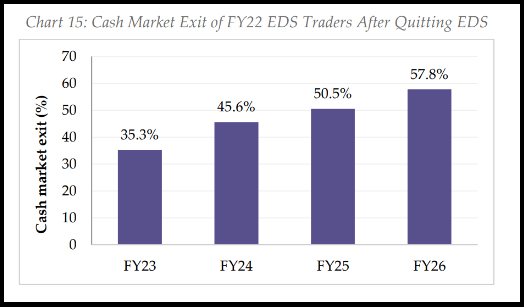
SEBI tracked the traders who left derivatives and checked what they did next. 58% of the FY22 cohort that exited F&O had stopped trading in the cash market entirely by FY26.
They did not graduate to investing. They did not move to mutual funds or long-term holdings. They left.
Where they went, the SEBI p&l report does not say. Nobody asked.
The exchanges have the data on who arrived and who departed. The question is simply not in either document.
Who Actually Loses: The Behavioural Findings
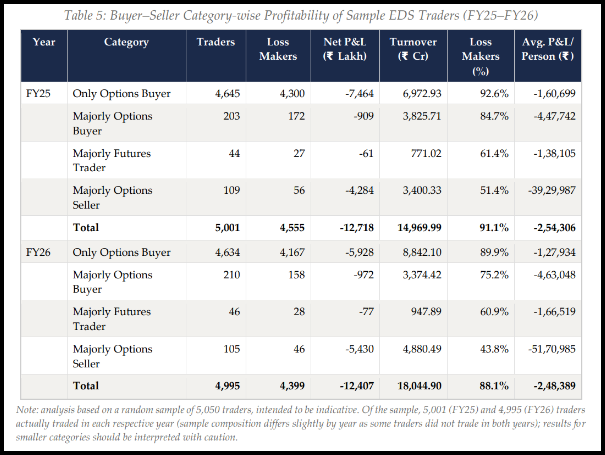
The behavioural study divides traders by what they actually did, using clearing corporation margin data on a random sample of 5,050 traders.
That sample size matters, and we will come back to it.
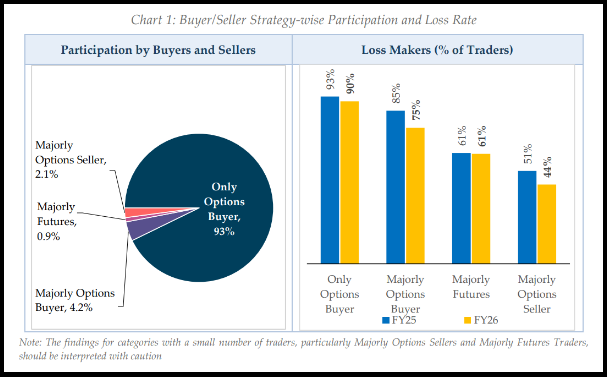
93% of individual traders are “Only Options Buyers.” SEBI’s definition is strict; they never once took a short option position across the entire year. Another 4% sold occasionally. Only about 2% were predominantly sellers.
Loss rates by category, FY26:
|
Category |
Share of traders |
Loss rate |
Average loss per trader |
|
Only Options Buyers |
93% |
90% |
₹1.3 lakh |
|
Majorly Options Buyers |
4% |
75% |
₹4.6 lakh |
|
Majorly Futures Traders |
<1% |
61% |
₹1.7 lakh |
|
Majorly Options Sellers |
2% |
44% |
₹51.7 lakh |
Read that table twice, because it contains a trap.
Options sellers have by far the best loss rate, 44%, meaning more than half of them made money. That number will appear in options-selling course advertisements within a week.
Now read the last column. When sellers lose, they lose ₹51.7 lakh on average, eleven times what buyers lose. A high win rate sitting on top of a large tail risk.
And here is the caveat SEBI buries: that entire seller category is 105 traders.
Two percent of a 5,050-person sample. Of those 105, 46 lost money. SEBI itself flags the section as indicative and advises interpreting with caution.
One hundred and five people is not a basis for a headline. It will become one anyway.
Experience Does Not Help
This is the finding most likely to change how a reader thinks.
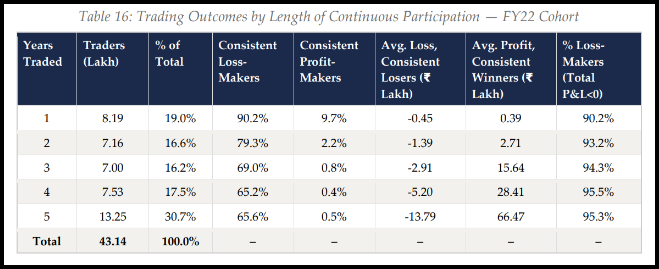
Loss rate by years of trading experience:
- 1 year: 90.97%
- 2 years: 94.40%
- 3 years: 96.03%
- 4 years: 96.52%
The longer you have been trading derivatives, the more likely you are to lose money. There is no learning curve visible in this data.
And of everyone who traded continuously across all five years from FY22 to FY26: 0.5% were profitable every year. 65.6% lost money every year.
The Rhythm of Losing
SEBI examined 4.02 crore individual trader-quarters. Only 15.4% were profitable.
The median winning quarter: ₹4,366. The median losing quarter: ₹10,525.
Among traders who had both winning and losing quarters, 78.7% had a bigger average loss than average gain. The entire market is running the exact opposite of the discipline every trading book teaches.
And when people quit, they do not quit thoughtfully. Between 86% and 89% of traders who stopped trading had lost money in the immediately preceding quarter.
Their final quarter’s loss averaged 2.23 times all their prior profits combined. For the worst-affected 10%, more than thirty times.
If you face issues with broker service standard compliance, you can lodge a SEBI SCORES complaint.
You can also seek resolution via the Smart ODR Platform.
The Part Nobody Covers: What You Pay to Trade
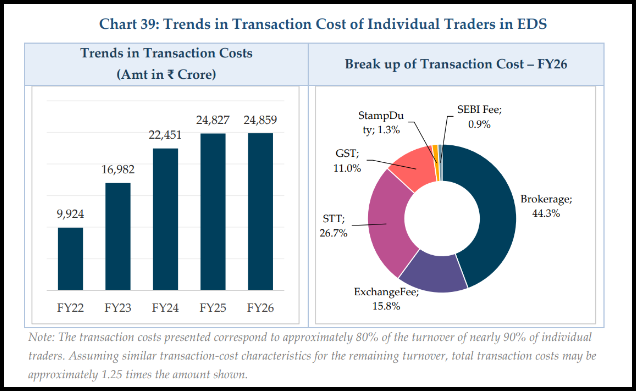
In FY26, individual traders paid ₹24,859 crore in transaction costs.
In FY25 they paid ₹24,827 crore.
Effectively identical, except that in FY26 turnover fell 5% and the number of traders fell 20%. Fewer people trading less, paying the same.
Per trader, costs rose from ₹26,027 to ₹31,628, a 21% increase.
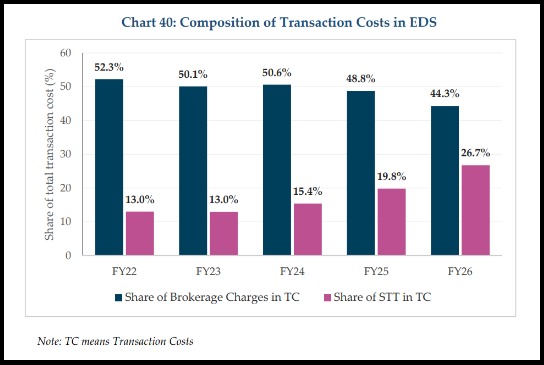
The composition explains it. Brokerage fell 9%. Exchange charges fell 6%. STT rose 35%.
Over five years, STT paid by individual traders has gone from ₹1,291 crore to ₹6,645 crore, more than five-fold. Its share of what a trader pays has climbed from 13% to 27%, while brokerage has fallen from 52% to 44%.
Whatever the discount brokers gave back, the statutory levy took.
Two figures make this more than an accounting note.
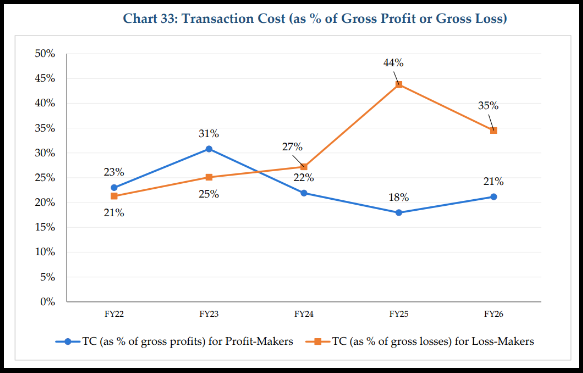
First, costs fall harder on the losing side. Transaction costs consumed 35% of loss-makers’ gross losses in FY26, against 21% of profit-makers’ gross profits.
In FY25, it was 44% for losers. The structure is regressive against the people already losing.
Second, and this is the single most under-reported number in either report: on a gross basis, before costs, 82.1% of FY26 traders lost money. After costs, 87.7%.
That 5.6 percentage-point gap is roughly 4.4 lakh traders who made money on their trades and became loss-makers after brokerage, STT and GST.
In FY25, the figure was 5.3 lakh. Across the two years, close to ten lakh people whose strategy that worked but whose bill did not.
STT applies to turnover regardless of outcome.
A trader who lost ₹1.5 lakh over the year paid the same levy as one who made ₹1.5 lakh, and the profitable one paid capital gains tax on top.
Also read: Is Your Broker Allowed to Give FnO Tips? What SEBI Rules Say
Did SEBI’s 2024 Measures Work?
Between October 2024 and April 2025, a package of changes landed on the derivatives market: STT increased on 1 October 2024; weekly expiries cut to one index per exchange, minimum contract value raised to ₹15–20 lakh, and additional margin on expiry-day short options from 20 November 2024; upfront premium collection and the withdrawal of calendar spread benefits on expiry day through early 2025.
Participation responded immediately. Between Q2 and Q4 of FY25, active traders fell 25%. Index options participation fell 27%, index futures 29%.
But among the traders who remained, average turnover per person rose by 12% in index options, 20% in index futures. The small traders left. The large ones got larger.
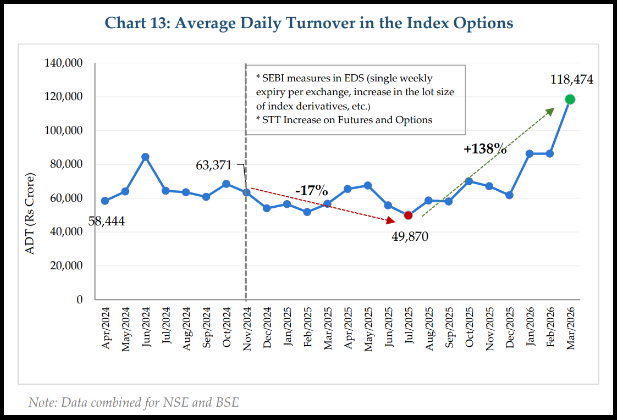
Volumes tell the clearest story. Average daily index options turnover before the measures: ₹65,935 crore. After: ₹54,771 crore, a 17% decline. It bottomed at ₹49,870 crore in July 2025.
By March 2026, it stood at ₹1,18,474 crore, roughly double the pre-measure level.
Expiry concentration followed the same arc. In October 2024, weekly expiry contracts accounted for 98% of index options turnover. By December, 82%. Then back to 97%.
SEBI’s own explanation, in the report: trading “simply shifted to the remaining weekly expiries.”
Fewer expiry days. Same behaviour, compressed into them.
There is one more thing worth noting, and it is not a criticism of the research so much as an observation about what the research declines to do.
Throughout both documents, SEBI repeats that the findings “do not establish a causal relationship” and represent “association in timing rather than evidence of causation.”
That is correct research practice.
But it means a major structural intervention was made in a market of this size, and the report published two years later does not say whether it achieved its objective, because the objective was never stated as a measurable target.
The Other Side of the Trade
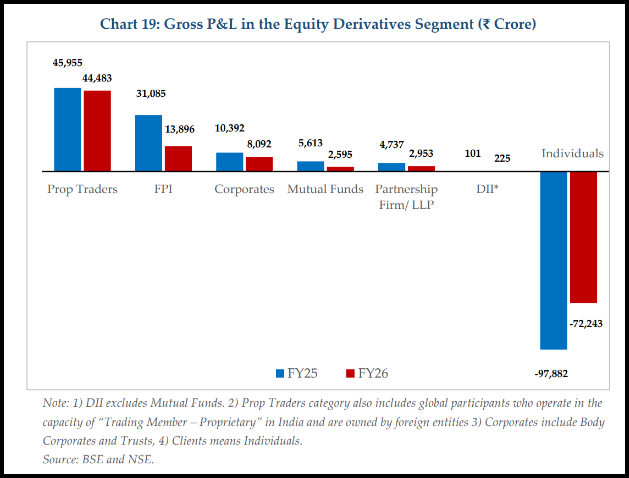
SEBI writes, in its own words: “Derivatives trading is largely a zero-sum activity before transaction costs, so one participant’s loss broadly corresponds to another’s gain.”
FY26 gross profit and loss by participant category:
|
Category |
Gross P&L |
|
Proprietary traders |
+₹44,483 crore |
|
FPIs |
+₹13,896 crore |
|
Corporates |
+₹5,962 crore |
|
Mutual funds |
+₹2,595 crore |
|
Individuals |
−₹72,243 crore |
Individuals are the only category in the red.
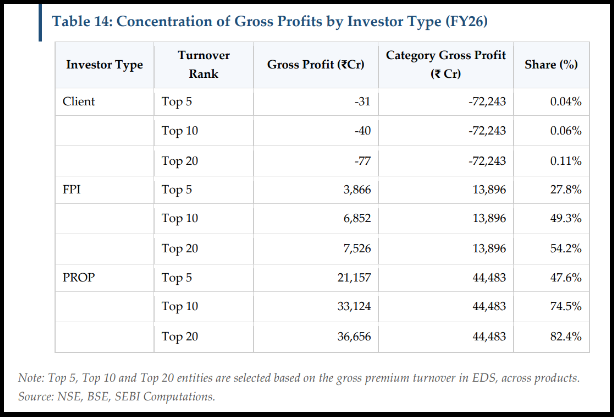
Within the proprietary category, there were 693 entities in FY26.
The top ten took ₹33,124 crore, 74.5% of the entire category’s profit. And 99% of proprietary and FPI profits came from algorithmic entities, up from 96% and 97% two years earlier.
SEBI frames this concentration as a market benefit, noting that these firms provide tighter spreads and continuous liquidity. In the same section, it writes that options liquidity “relies on a relatively small set of large proprietary trading firms.”
Both statements are in the report. Whether that is a feature or a risk is left to the reader.
Where the Money Actually Went?
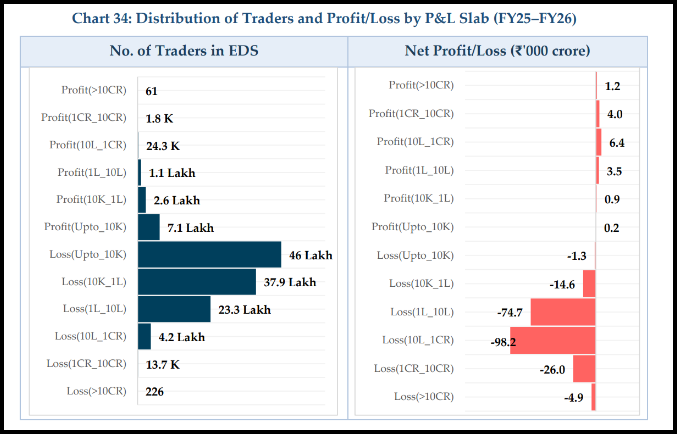
The distribution chart is the most revealing page in either document, and it works because the two panels are shaped opposite to each other.
Among the 111.6 lakh traders who lost money across FY25–FY26:
- 75% of them lost under ₹1 lakh each, and account for just 7% of total losses.
- The remaining 25% account for 93%.
The single largest concentration sits in one slab: 4.2 lakh people who lost between ₹10 lakh and ₹1 crore, totalling ₹98,200 crore.
Around 3.8% of loss-makers carry nearly half the damage.
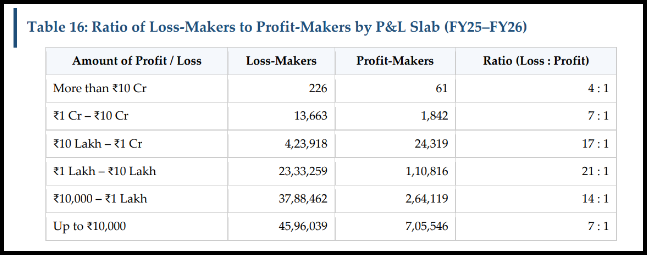
At the extreme: 226 people lost more than ₹10 crore each, totalling ₹4,900 crore, nearly four times what 46 lakh small losers lost combined.
Now the profit side. Among the 11.1 lakh traders who made money:
- 88% of them made under ₹1 lakh, and account for just 7% of total profits.
- The remaining 12% account for 93%.
The mirror is exact. And there is a detail inside it worth sitting with: 7.1 lakh of those 11.1 lakh “profit-makers”, 64% of everyone who won, made under ₹10,000 across two full years. Average: ₹2,835.
Only about 26,000 people out of 1.22 crore made more than ₹10 lakh.
Totals across the two years: ₹16,211 crore made. ₹2,19,684 crore lost. For every rupee an individual made in F&O, individuals lost ₹13.55.
Who Lost Less, and Why?
The reports also contain a gradient, a set of characteristics that consistently correlate with smaller losses. None of these describe a profitable group.
Every category below is still majority-loss. But the direction is consistent enough to be worth understanding.
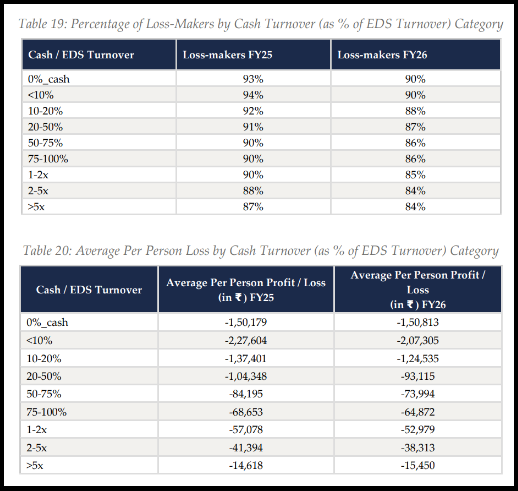
Cash market participation. Traders whose cash turnover was under 10% of their derivatives turnover had a 90% loss rate and an average loss of ₹2.07 lakh.
Traders whose cash turnover exceeded derivatives by more than 5x had an 84% loss rate and an average loss of ₹15,450, thirteen times less damage.
SEBI identifies the mechanism in the same section: the second group’s average derivatives turnover was around ₹10 lakh against ₹5.44 crore for the first.
They simply traded far less in derivatives.
- Trading frequency. Under 10 trading days a year: median loss ₹654. Over 100 days: median loss ₹76,722. That high-frequency group is 42% of traders and 87% of all losses.
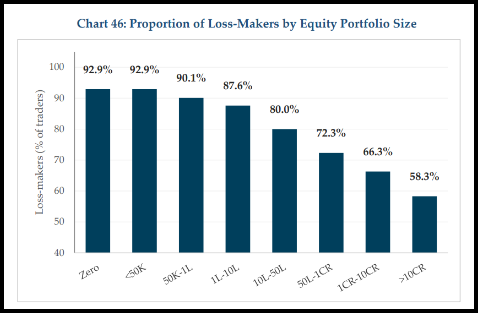
- Portfolio size. Loss rate falls in an unbroken line: 93% for those holding no shares or under ₹50,000, 88% at ₹1–10 lakh, 72% at ₹50 lakh–₹1 crore, 58% above ₹10 crore.
- Product. Futures traders lose far less often than options traders: 66% against 87.7%. Index futures, at 62%, is the best outcome of any product in the report. But this matters less than it sounds: 93% of traders never touch futures at all.
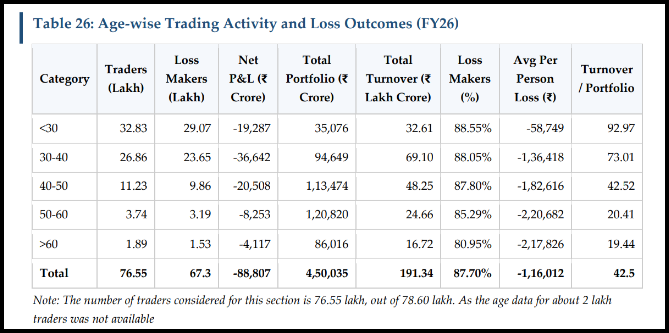
- Age. Loss rate falls with age, from 88.55% under 30 to 80.95% above 60. The average loss moves the other way: ₹58,749 under 30, rising to ₹2.20 lakh in the 50–60 band. Older traders lose less often and far more when they do.
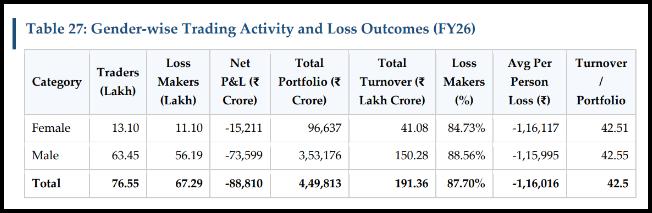
- Gender. Women had a loss rate of 84.73% against 88.56% for men. Average loss was almost identical: ₹1,15,995 against ₹1,16,117. Women’s participation rose from 13.7% to 17.1%.
The Uncomfortable Part
It would be easy to read all of this as a story about a market designed to extract from retail participants. That reading is available, and parts of the data support it.
But it would be incomplete.
A significant number of people arrive at derivatives believing the market is a money-making machine, a place where capital compounds quickly if you find the right setup.
That belief is not manufactured entirely by brokers or regulators. It arrives through social media, through visible success stories, through a genuine and understandable desire to build wealth faster than a salary allows.
The behavioural data reflects it. 35% of F&O traders own no cash equity at all. 24% had zero cash market turnover in FY26. Traders under 40 are 78% of the market and hold 29% of the equity.
The turnover-to-portfolio ratios, 75x for those declaring under ₹5 lakh income, describe people using derivatives as a substitute for capital rather than a complement to it.
And the reports also show that six percent of the sample deployed more derivatives capital than their entire declared annual income.
None of that is a regulatory failure. Some of it is a decision.
What the reports establish is that the outcome distribution is exceptionally unforgiving, that experience does not appear to improve it, and that costs push a meaningful number of otherwise-successful traders into loss.
What individuals do with that information is their own call.
The honest summary is that responsibility here is distributed. The trader who deploys eight times his portfolio value on a weekly expiry owns that decision.
The cost structure that converts four lakh profitable traders into loss-makers is not his decision. Both things are in the same report.
What the Reports Do Not Cover?
Worth knowing, because these absences shape what conclusions are available. There is no analysis of technical glitches or platform outages.
No examination of broker risk-management policies that square off client positions automatically; the reports mention auto-square-off only in a footnote, explaining that it inflates the apparent 15% figure for individual algorithmic trading.
No treatment of volatility spikes. No follow-up on where the 45.7 lakh exiting traders went. And no concluding recommendation in either document.
Five reports across four years. The diagnosis is now extraordinarily detailed. The prescription has not been written.
This article analyses two publicly available SEBI research reports: “Profitability of Individual Traders in the Equity Derivatives Segment (FY25–FY26)” and “Trading Behaviour of Individual Traders in the Equity Derivatives Segment (FY25–FY26)”, both published in August 2026 by the Department of Economic and Policy Analysis. It is not investment advice and contains no recommendation to buy or sell any security. Derivatives trading involves substantial risk of loss.
Report. Recover. Stay Fraud Free.
Frequently Asked Questions
87.7% of individual equity derivatives traders lost money in FY26, according to SEBI's August 2026 report. On a gross basis, before transaction costs, the figure was 82.1%.
₹91,685 crore net. Loss-makers actually lost ₹1.03 lakh crore; profit-makers made about ₹12,000 crore, netting to the published figure. SEBI notes the full-market figure would be roughly 1.11 times higher.
₹3,84,856 crore across FY22 to FY26. The two years FY25–FY26 alone account for ₹2.03 lakh crore.
In SEBI's FY26 sample, 56% of predominantly-selling traders were profitable, the best rate of any category. However, sellers who lost money lost an average of ₹51.7 lakh, eleven times the buyers' average. The seller category comprised 105 traders in a 5,050-person sample, and SEBI flags it as indicative only.
No. SEBI's data shows loss rates rising with experience: 90.97% at one year, 94.40% at two, 96.03% at three, 96.52% at four.
₹6,645 crore in FY26, up 35% year on year and more than five times the FY22 figure of ₹1,291 crore. STT now accounts for 27% of a trader's total transaction costs, up from 13%.
Participation fell sharply, around 25% between Q2 and Q4 of FY25. Volumes fell 17% initially, then recovered to roughly double pre-measure levels by March 2026. Weekly expiry share fell from 98% to 82% before returning to 97%. SEBI explicitly states its findings do not establish causation.
About 26,000 individuals out of 1.22 crore made more than ₹10 lakh across FY25–FY26. Roughly 1.1% made more than ₹1 lakh.



 Add us as a preferred source on Google »