
Quick Summary
Stock Research Analytics 360 is a SEBI registered Research Analyst run by Rajeshwar Mandal, INH000018878, active since November 2024. Of the seven billing cycles published across its nine research services, six breach the ₹1,51,000 annual SEBI fee ceiling when annualised. The Platinum monthly plan alone runs to nearly ₹18 lakh a year, close to twelve times the limit. Its complaint disclosure has not been updated since April 2026, and the annual complaint table shows zero complaints for a year in which the monthly table already records one. The website also describes itself in language closer to personalised investment advice than the research service its registration actually covers.
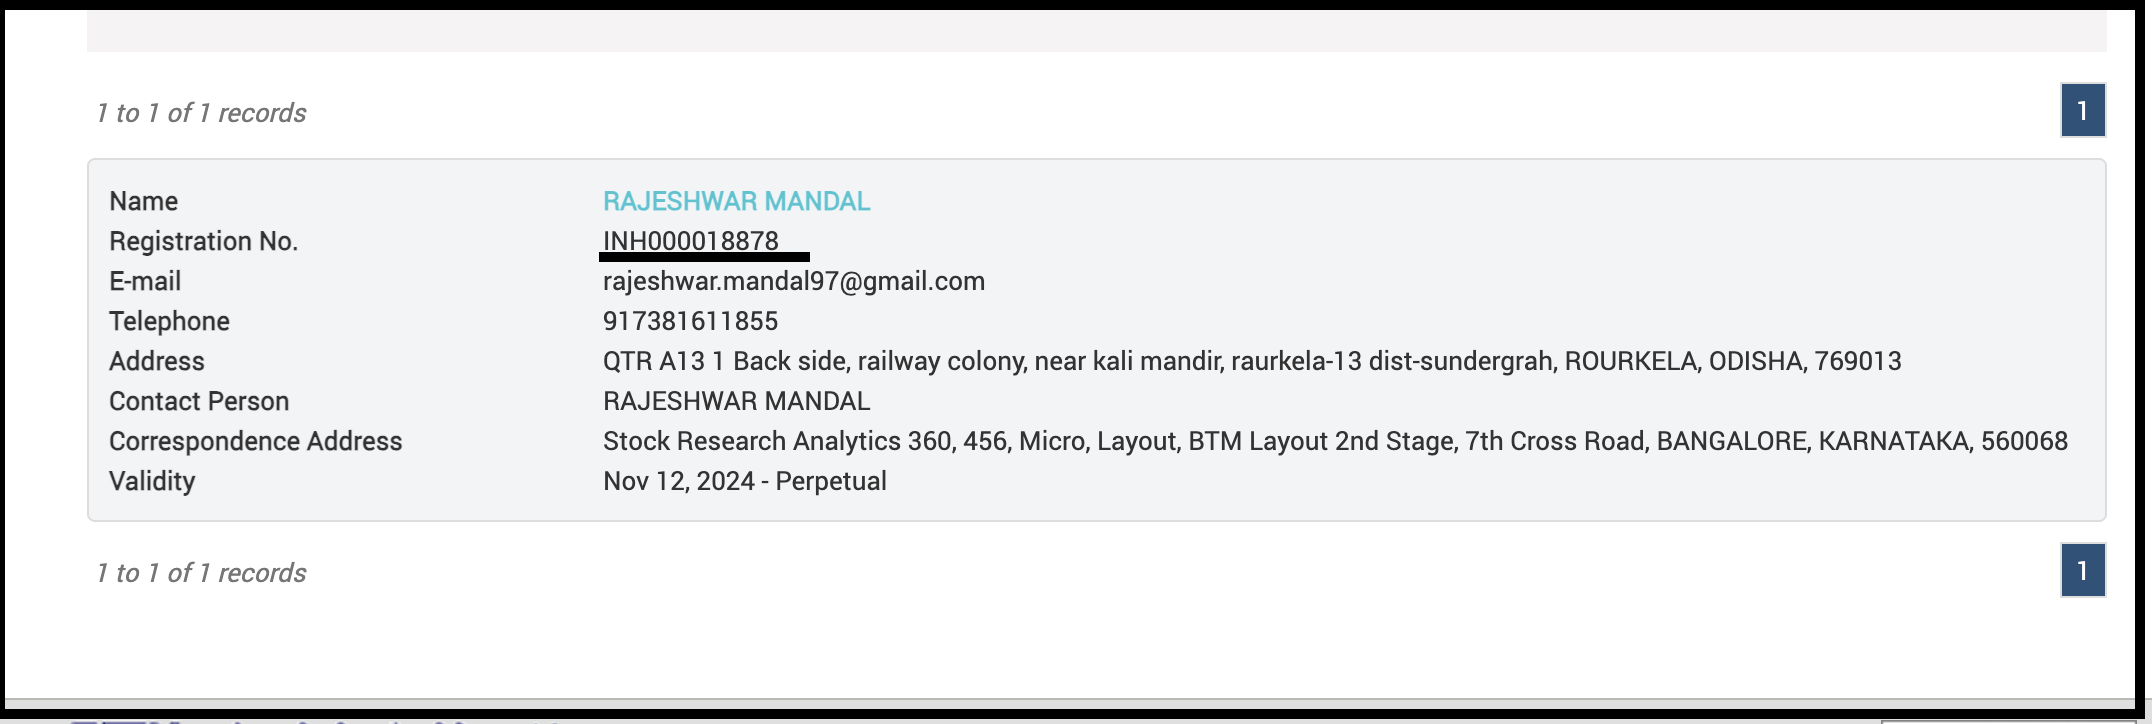
Stock Research Analytics 360 holds SEBI Research Analyst registration INH000018878, held by Rajeshwar Mandal.
The registration is genuine and confirmed independently across the firm’s own site and its social media bios. What is not fine is the pricing page.
Of seven billing cycles published across nine services, six breach the SEBI annual fee ceiling, one of them by close to twelve times the limit on a single plan.
This page works through the registration, the full pricing grid against the ₹1,51,000 cap, the complaint disclosure and its reconciliation gap, and language on the site worth reading carefully before you subscribe.
Stock Research Analytics 360 Review
Stock Research Analytics 360, styled SRA360, is run by Rajeshwar Mandal, who is identified as Research Head and states he has over 10 years of experience in the stock market since 2014, having worked previously as an Equity Advisor, Financial Counsellor and Portfolio Modeler before moving into sales.
The site highlights expertise in Price Action Trading, Open Interest and Participant Data analysis, Elliott Wave theory, option chain analysis, and what it calls Trap Trading.
Its nine subscription services span equity cash, stock and index futures, stock and index options, and commodities across bullion, energy and base metals, alongside live mentorship for trading across all of these segments.
The firm’s own About page describes itself as “providing professional investment advice” with advisory services it says are tailored to a client’s risk tolerance, financial goals, and portfolio.
That is the language of personalised financial advice, and it sits differently from the research service an INH registration actually covers, a distinction worth a closer look further down this page.
None of this establishes wrongdoing, and nothing further on this page does either.
Where a registered analyst’s conduct does cross a line, the formal escalation route is covered in full further down this page.
Is Stock Research Analytics 360 SEBI Registered?
Yes, and the registration is confirmed independently across the firm’s Instagram bio, its X account, and SEBI’s own published Research Analyst records.
| Detail | Information |
| Registered Person | Rajeshwar Mandal |
| Business Name | Stock Research Analytics 360 |
| SEBI Registration Number | INH000018878 |
| Validity | 12 November 2024, Perpetual |
| Registered Address | QTR A13/1 Back Side, Railway Colony, Near Kali Mandir, Rourkela-13, Sundergarh, Odisha 769013 |
| Correspondence Address | 456, Micro Layout, BTM Layout 2nd Stage, 7th Cross Road, Bangalore, Karnataka 560068 |
| Contact Person | Rajeshwar Mandal |
What the INH Prefix Permits, and Where This Firm’s Own Language Drifts From It
The INH prefix marks a Research Analyst. It permits publishing research and issuing recommendations to a subscriber base.
It does not permit personalised advice built around an individual client’s income, goals or holdings, trade execution, or portfolio management, each of which falls under a separate Investment Adviser or Portfolio Manager licence.
The firm’s own About page states its advisory services are “tailored to your needs” and aim at alignment between your risk tolerance, financial aspirations, and investment portfolio.
That description reads closer to personalised financial planning than to general research distributed to a subscriber base.
This is the firm’s own published language, not a third party’s characterisation of it.
It may simply be loosely worded marketing copy rather than a description of what actually happens once you subscribe.
Ask directly whether any service offered to you is tailored to your specific financial position, and if so, confirm which registration covers that, since INH000018878 on its own does not extend that far.
Also Read: Shubham Ganesh Shirkar, a winning stock pick, publicly highlighted. What about the losses?
Stock Research Analytics 360 Pricing and the ₹1,51,000 SEBI Fee Cap
This is the most serious finding on this page, and it deserves the fullest possible arithmetic rather than a summary.
A Research Analyst may charge a maximum of ₹1,51,000 per annum per family, excluding statutory charges, for individual and HUF clients who are not accredited investors.
The pricing page does not identify any tier as intended for accredited investors specifically, so the retail ceiling applies.
The Published Price Grid
Eight of the nine listed services, Equity Cash Short Term, Stock Futures, Stock Options, Index Futures, Index Options, Bullions, Base Metals and Energy, share an identical price structure across three tiers.
| Tier | Monthly | Quarterly | Half Yearly |
|---|---|---|---|
| Gold | ₹29,999 | ₹49,999 | ₹74,999 |
| Diamond | ₹49,999 | ₹89,999 | ₹1,49,999 |
| Platinum | ₹1,49,999 | Not offered | Not offered |
Annualised Against The Cap
| Plan and Cycle | Annualised | Against the Cap |
|---|---|---|
| Gold, Monthly | ₹3,59,988 | Over by ₹2,08,988 |
| Gold, Quarterly | ₹1,99,996 | Over by ₹48,996 |
| Gold, Half Yearly | ₹1,49,998 | Under by ₹1,002 |
| Diamond, Monthly | ₹5,99,988 | Over by ₹4,48,988 |
| Diamond, Quarterly | ₹3,59,996 | Over by ₹2,08,996 |
| Diamond, Half Yearly | ₹2,99,998 | Over by ₹1,48,998 |
| Platinum, Monthly | ₹17,99,988 | Over by ₹16,48,988 |
Only One Cycle Out Of Seven Stays Inside The Ceiling
Gold billed half-yearly is the sole compliant cycle on this entire pricing grid, and even that clears the ceiling by a margin of only ₹1,002.
Every other published cycle, on every one of the eight identically priced services, breaches ₹1,51,000 when annualised.
The Platinum plan is the sharpest figure on this page. At ₹1,49,999 a month, twelve months comes to nearly ₹18 lakh a year, close to twelve times what SEBI permits a Research Analyst to charge an individual or HUF client.
Multiplying that across the nine services on offer is not a realistic reading of a single client’s likely spend.
The relevant comparison is simpler: pick any one service at any cycle other than Gold Half Yearly, and that single subscription alone already exceeds the annual limit on its own.
The Equity Cash Long Term Service Is Priced Differently, and Inconsistently
The ninth service, Equity Cash Long Term, does not follow the pattern above.
Its published price is ₹49,999 regardless of whether the cycle selected is Monthly, Quarterly, or Half Yearly, and its Diamond tier is priced at a flat ₹99,999 across all three cycles in the same way.
A service priced identically whether billed monthly or half-yearly is unusual, since it means choosing the shorter cycle costs a client nothing extra despite covering less time, while choosing the longer cycle delivers six months of service for the price other services charge for one month.
This may be a genuine promotional structure specific to this one service, or it may be an error in how the pricing table was built.
Either way, confirm in writing which cycle you are actually being billed under before paying for this specific service.
None of this proves any specific client has been charged above the ceiling.
The published grid is what it is, and the arithmetic above is what it produces once annualised.
If you are subscribing to anything on this pricing page other than Gold billed half yearly, add up your actual annual cost and compare it to ₹1,51,000 before you pay.
One protection applies regardless of the plan. On early termination, a client is entitled to a proportionate refund for the unexpired period, and a Research Analyst may not retain a breakage fee.
What Does Stock Research Analytics 360’s Complaint Data Show?
This section carries two separate problems: the disclosure is stale, and the annual table does not match the firm’s own monthly data for the same year.
Current Complaint Status
| Received From | Previous Pending | Received This Month | Resolved | Pending at End of Month | Avg. Resolution Time |
|---|---|---|---|---|---|
| Directly from Investors | 0 | 0 | 0 | 0 | N/A |
| SEBI (SCORES) | 1 | 0 | 1 | 0 | 25 days |
| Other Sources | 0 | 0 | 0 | 0 | N/A |
| Grand Total | 1 | 0 | 1 | 0 | N/A |
This table covers the month ending April 2026 and shows a single SCORES complaint opened on 20 March 2026 and closed on 14 April 2026.
Monthly Disposal Trend, Months With Activity
| Month | Carried Forward | Received | Resolved | Pending |
|---|---|---|---|---|
| March 2026 | 0 | 1 | 0 | 1 |
| April 2026 | 1 | 0 | 1 | 0 |
| Grand Total | 1 | 1 | 1 | 0 |
Annual Complaint Table and What This Actually Shows
The annual disposal table published on the site shows zero complaints received, resolved, or pending for the entire financial year covering March and April 2026.
1. The Disclosure Has Not Been Updated in Five Months
The most recent data published covers April 2026.
As of September 2026, that leaves May through August entirely unaccounted for, well past SEBI’s requirement that complaint data be refreshed by the 7th of the following month.
2. The Annual Table Directly Contradicts the Firm’s Own Monthly Data
The one complaint received in March 2026 and resolved in April 2026 is a matter of record in the firm’s own monthly table.
The annual table for the same financial year shows zero received, zero resolved. This is not a missing period.
It is a contradiction between two tables published by the same firm covering the same complaint.
We are not asserting which table is correct.
What can be said plainly is that a prospective client checking only the annual summary would see a clean nil history, while the monthly table sitting on the same site records an actual complaint that the annual table omits entirely.
Also Read: Rajendra Vitthal Suryawanshi, an RA with an 11-complaint gap between two tables covering the exact same month.
What Marketing Language on the Website Needs a Closer Look?
The site’s testimonials and homepage copy use several phrases worth reading with caution rather than at face value.
1. Return-Oriented Testimonials
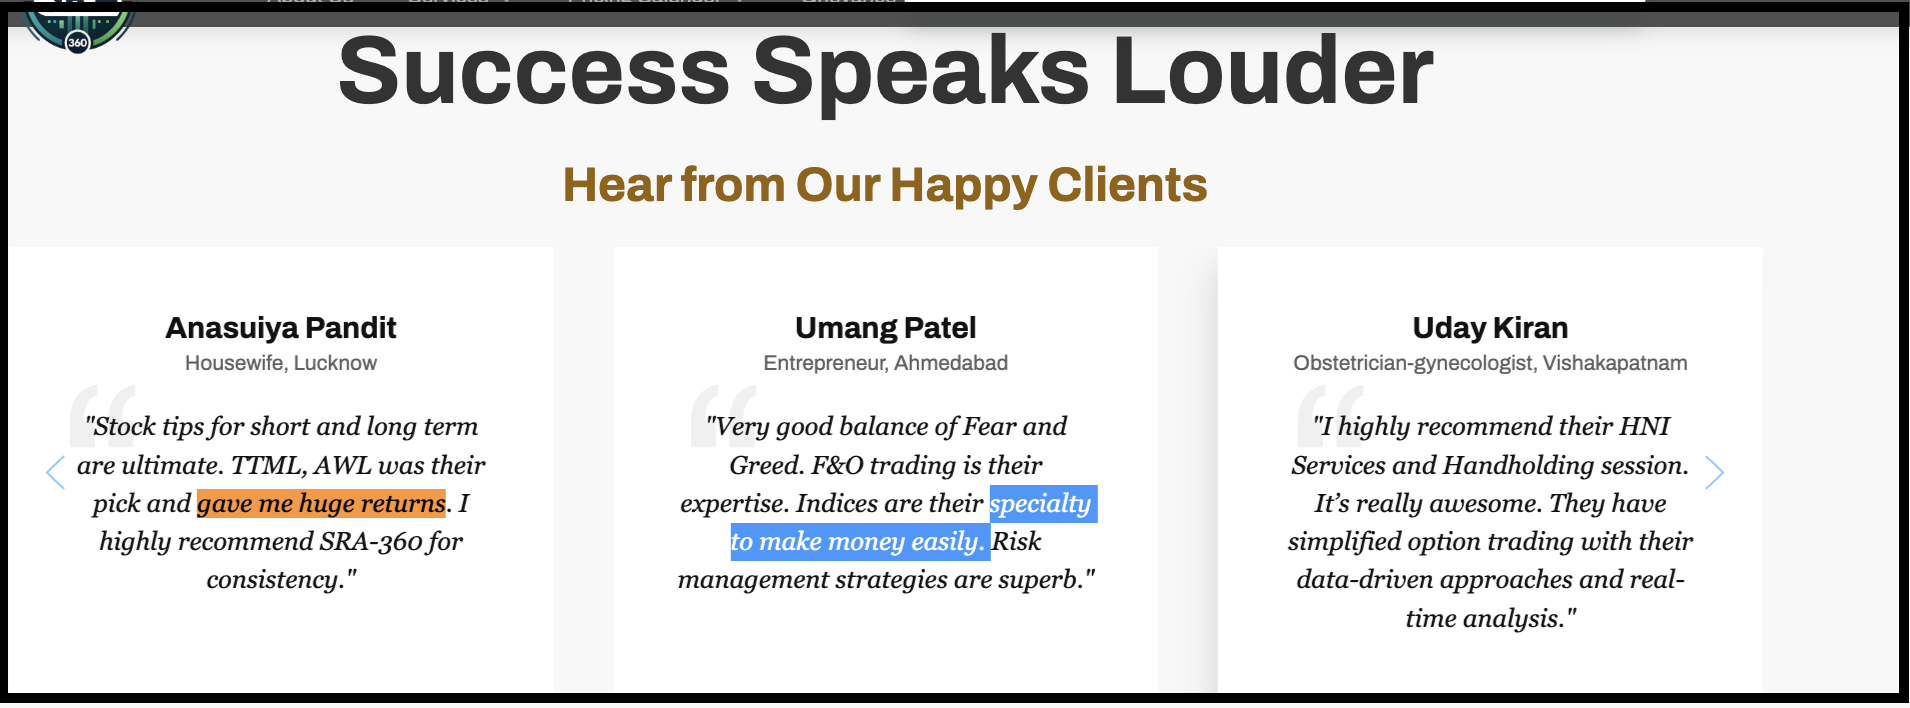
Published testimonials state that a stock pick “gave me huge returns,” that the team can “make money faster,” and that its index expertise helps investors “make money easily.”
Language promising ease or speed of returns is the kind of claim SEBI’s advertisement code specifically treats as a misleading or deceptive testimonial, regardless of whether the underlying experience described was genuine.
2. A “Proven Track Record” Claim With Nothing Published Alongside It
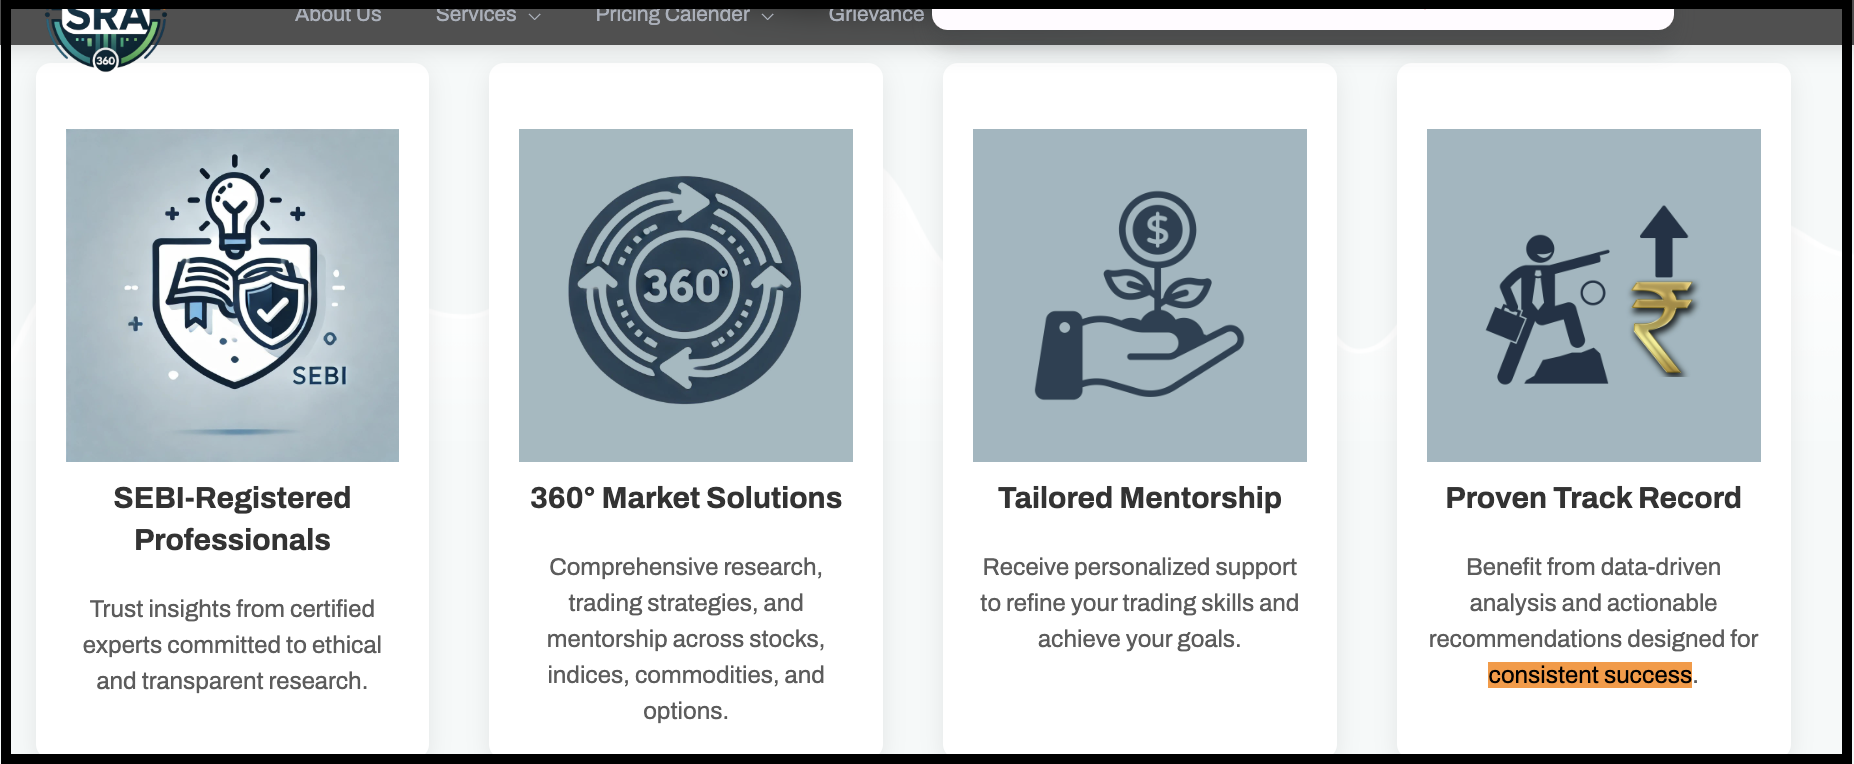
The homepage describes a “Proven Track Record” and recommendations designed for “consistent success.”
No performance figures, win rate, or supporting data accompany either statement anywhere in the material reviewed here.
3. Live Promotional Posts Describing Specific Trade Outcomes
Beyond the site itself, the firm’s public social media has posted specific trade results with dramatic framing, describing options positions moving from an entry price to several times that value, accompanied by promises that another big day is coming.
Posts of this kind, without a stated loss record alongside them, present an incomplete picture of the actual outcomes a subscriber should expect.
None of this amounts to an explicit guarantee of returns in the way SEBI orders have treated direct profit promises.
It is the kind of language SEBI’s advertisement framework specifically cautions against, particularly the phrases suggesting ease or speed, and it sits directly alongside a pricing grid that breaches the fee cap on all but one cycle.
The fee cap arithmetic and the complaint data contradiction both give a complaint here firmer ground than a dispute over research quality would.
Start by working out your actual annual cost if you are subscribed to anything other than the Gold half-yearly cycle.
Ask the firm directly, in writing, whether your specific plan is intended for an accredited investor, since nothing on the public pricing page states this.
Also ask for a reconciliation of the annual and monthly complaint tables for the year covering March and April 2026.
Send your grievance to the RA firm’s email, describing what you were told, what you paid, and what you want resolved.
Keep the sent record regardless of what comes back.
If the response is not satisfactory, escalation runs through a specific set of channels, and each one exists for a different stage of the dispute rather than as alternatives to pick from.
1. SEBI SCORES: File your complaint on the SEBI SCORES complaint portal.
2. SMART ODR: Move to structured conciliation through the SMART ODR portal if SCORES does not resolve it.
3. Arbitration: Where conciliation still does not settle it, arbitration in stock exchange proceedings ends in a binding, enforceable award.
These steps cover most cases, but the right path depends on your specific situation.
If you want to know the full process in detail, check our guide complaint against SEBI registered research analyst.
Paying close to ₹18 lakh on a capped plan?
We total your invoices against the SEBI ceiling, calculate the exact excess, and put the figure on record in a form the analyst has to respond to. Register with us for a free read on your situation.
Disclaimer
This page is based on Stock Research Analytics 360’s own published material, its public social media bios, and the SEBI intermediary register, current as of September 2026, and alleges no wrongdoing since no SEBI order stands against the firm.
Registration details, pricing, and website content can change, so verify everything at source before acting. Treat this page as research, not legal or investment advice.
Conclusion
Stock Research Analytics 360 is a genuinely registered SEBI Research Analyst, INH000018878, held by Rajeshwar Mandal since November 2024.
Its pricing grid is the sharpest problem on this page. Six of seven published billing cycles breach the SEBI fee ceiling, and the Platinum plan alone runs to nearly ₹18 lakh a year, close to twelve times the limit.
Its complaint disclosure has not been updated since April 2026, and its annual table shows zero complaints for a year, while its own monthly table records one.
Before subscribing to anything on this pricing page other than Gold billed half yearly, work out your actual annual cost and confirm your client category in writing.
Report. Recover. Stay Fraud Free.
Frequently Asked Questions
Yes. It is registered to Rajeshwar Mandal, operating as Stock Research Analytics 360, from 12 November 2024 and is perpetual. Confirm it directly on the SEBI register rather than relying on the website alone.
Six of the seven published cycles do, including every Diamond and Platinum tier and both Gold monthly and quarterly cycles. Only Gold billed half yearly stays under the ₹1,51,000 ceiling, and only by about ₹1,000.
At ₹1,49,999 a month, twelve months comes to nearly ₹18 lakh a year, close to twelve times the ₹1,51,000 annual ceiling for an individual or HUF client.
The site does not explain the gap. The monthly table for March and April 2026 records one complaint received and resolved, while the annual table for the same year shows none, which is a direct contradiction rather than a missing reporting period.
Its About page describes advisory services "tailored to your needs" in language closer to personalised financial advice than general research. Confirm directly which registration covers any service offered to you, since the firm's confirmed registration is a Research Analyst licence, not an Investment Adviser one.





 Add us as a preferred source on Google »